
Unaffected by the Banking Crisis, New Home Sales Remained Solid in March
NEWPORT BEACH, Calif., April 21, 2023 /PRNewswire-PRWeb/ -- Today, the experts at Zonda, the housing industry's foremost advisors, released the New Home Market Update report for March 2023.
There were concerns that the economic uncertainty following the collapse of Silicon Valley Bank might cause prospective homebuyers to pull back, but Zonda's data captures that March was another solid month for the market. Zonda's New Home Pending Sales index rose 1.0% month-over-month.
Homebuilders are reaping the benefits of a dysfunctional housing market. New listings on the resale side have not risen enough to match the seasonal uptick in demand. Further, competition from other builders is limited as total community count is 28.9% below 2019 levels. The combined effect leaves buyers short of options and builders with inventory experiencing healthy sales activity.
Not only do builders represent the 'only game in town' in some instances, but they are also often able to meet buyers where they are in terms of monthly payment. An increasing share of builders are offering incentives, especially mortgage rate buydowns, to help address today's affordability constraints.
"Home shoppers, frustrated by the lack of resale inventory and high prices, are pleasantly surprised by the options and offers available from the new home side," said Ali Wolf, chief economist for Zonda. "Quick move-in homes were viewed more of a liability when the demand pool retrenched at the end of last year but are more of an asset today as buyers look to move during the spring selling season."
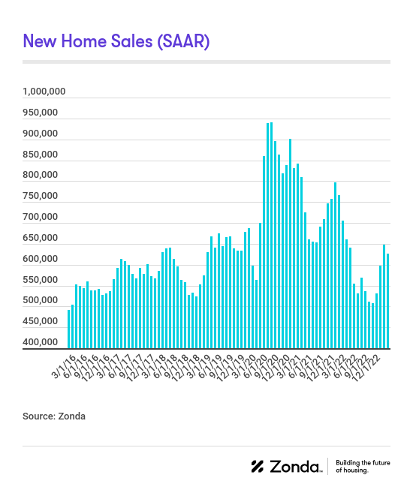
Spring selling season continued with solid numbers
Zonda's new home sales metric counts the number of new home contract sales each month and accounts for both cancellations and seasonality. This metric shows there were 625,974 new homes sold in March on a seasonally adjusted annualized rate. This was a decline of 3.4% from last month and a drop of 11.3% from a year ago. On a non-seasonally adjusted basis, 58,133 homes were sold, up 6.2% from last month, but 11.7% lower than last year and 1.1% below the same month in 2019.
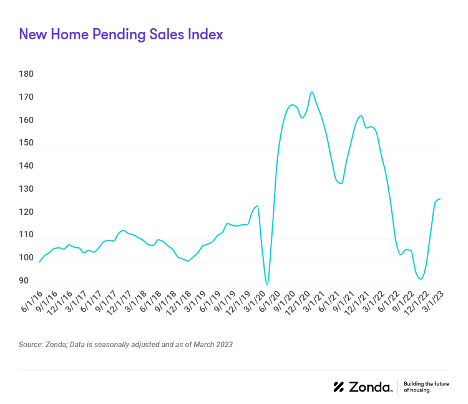
The pace of home sales continued to increase in March
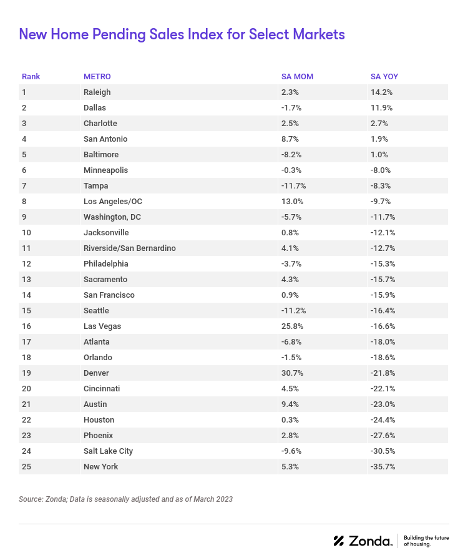
Total sales volume is influenced by both supply and demand. Zonda's New Home Pending Sales Index (PSI) was created to help account for fluctuations in supply by combining both total sales volume with the average sales rate per month per community. The March PSI came in at 127.8. This represents a 13.1% decline from the same month last year but a 1.0% seasonally adjusted month-over-month increase. The index is currently 26.6% below cycle highs.
- • The markets that posted the best numbers relative to last year were Raleigh (+14.2%), Dallas (+11.9%), and Charlotte (+2.7%).
- • The metros that performed the worst year-over-year were New York (-35.7%), Salt Lake City (-30.5%), and Phoenix (-27.6%). New York and Phoenix rose month-over-month, though.
- • On a monthly basis, Denver, Las Vegas, and Los Angeles/OC were the best performing markets. Denver increased 30.7% relative to last month as the market showed a notable improvement from the weak sales at the end of last year.
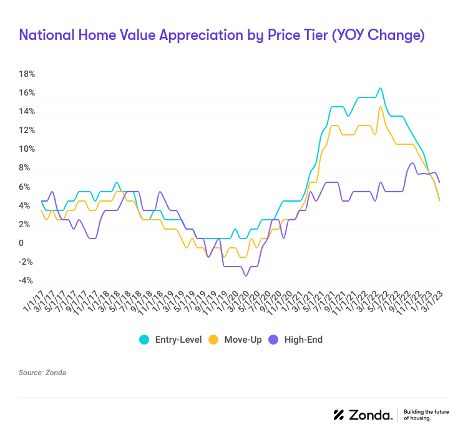
Home prices continued to decelerate
National home prices increased year-over-year across entry-level, move-up, and high-end homes. Prices rose 7.1% for entry-level to $336,763, 7.0% for move-up to $527,016, and 8.0% for high-end homes to $912,375.
Supplementing our data with a monthly survey Zonda conducts, the majority of builders reported holding their prices flat month-over-month from February to March. Roughly 8% of builders lowered prices and 33% increased them.
Incentives are still common in today's housing market given the lower levels of sales. 58.3% of active projects are offering to-be-built incentives, up from last month. The average incentive dollar amount is $12,833 or 2.5% of the list price.
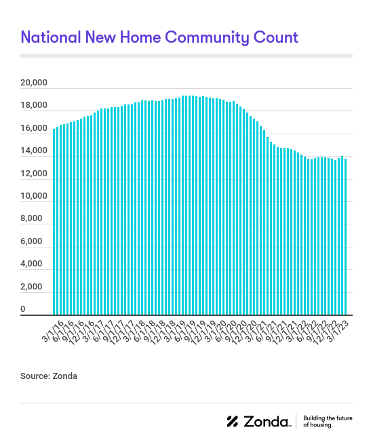
Total community count bouncing along the bottom
There are currently 13,747 actively selling communities tracked by Zonda, down 1.4% from last year. On a month-over-month basis, the national figure slipped 1.8%. Total community count is 28.9% below the same month in 2019. The lack of competition from other new home communities is allowing for some upward pressure on the average sales rate per month per community. Zonda defines a community as anywhere where five or more units are for sale.
- • Riverside/San Bernardino (+27.4%), Los Angeles/OC (+15.1%), and Phoenix (+13.6%) grew community count the most year-over-year. Total community count in these markets is -7.2%, -48.1%, and -6.9% compared to 2019, respectively.
- • Community count fell the most in Baltimore (-17.0%), New York (-15.7%), and Tampa (-13.3%) relative to last year. Total community count in these markets is -66.2%, -37.2%, and -49.9% compared to 2019, respectively.
- • Community count in 4% of our select markets rose month-over-month, none were flat, and 96% fell.
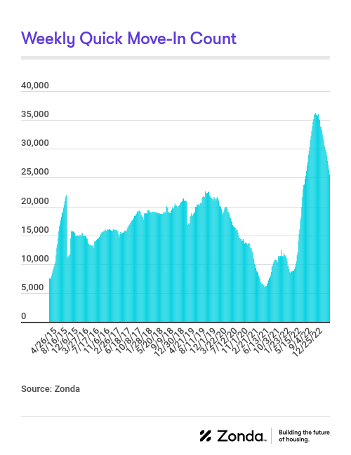
National quick move-ins (QMIs) totaled 25,493, up 180.0% compared to last year but 13.4% lower month-over-month. Total QMIs are 28.2% above 2019 levels. QMIs are homes that can likely be occupied within 90 days.
In many cases, builders have been willing and able to offer more aggressive price cuts and/or incentives to help sell QMIs over the past six months, and the month-over-month drop captures the effectiveness. Further, QMIs have been preferred by some consumers looking to move now as inventory on the resale market remains constrained.
- • On a metro basis, 96% of Zonda's select markets increased QMI count year-over-year.
- • The markets that grew the most year-over-year were Phoenix (+739.8%), Jacksonville (+357.6%), and Raleigh (+323.0%).
- • Jacksonville, Phoenix, and Sacramento have seen the most growth in QMIs compared to the same time in 2019, up 440.1%, 215.6%, and 209.7%, respectively. QMIs are down the most in San Diego, San Jose, and Durham compared to 2019.
Methodology
The Zonda New Home Pending Sales Index (PSI) is built on proprietary, industry-leading data that covers 60% of the production new home market across the United States. Reported number of new home pending contracts are gathered and analyzed each month. Released on the 15th business day of each month, the New Home PSI is a leading indicator of housing demand compared to closings because it is based on the number of signed contracts at a new home community. Zonda monitors 18,000 active communities in the country and the homes tracked can be in any stage of construction.
The new home market represents roughly 10% of all transactions, allowing little movements in supply to cause outsized swings in market activity. As a result, the New Home PSI blends the cumulative sales of activity recently sold out projects with the average sales rate per community, which adjusts for fluctuations in supply. Furthermore, the New Home PSI is seasonally adjusted based on each markets' specific seasonality, removes outliers, and uses June 2016 as the base month. The foundation of the index is a monthly survey conducted by Zonda. It is necessary to monitor both new and existing home sales to establish an accurate picture of the relative health of the residential real estate market.
Visit ZondaHome.com or follow us on LinkedIn and Facebook for more information.
About Zonda
Zonda provides data-driven housing market solutions to the homebuilding industry. From builders to building product manufacturers, mortgage clients, and multifamily executives, we work hand-in-hand with our customers to streamline access to housing data to empower smarter decisions. As a leading brand in residential construction, our mission is to advance the home building industry, because we believe better homes mean better lives and stronger communities. Together, we are building the future of housing.
Media Contact
Valerie Sheets, Zonda, 949-294-9557, [email protected]
SOURCE Zonda

Share this article